Click the Options button on the toolbar to change X-NetStat program settings.
General Connection Table Friendly Names Rules Programs Viewbar Remote Access Logging Packet Sniffer Advanced Extra Options
|
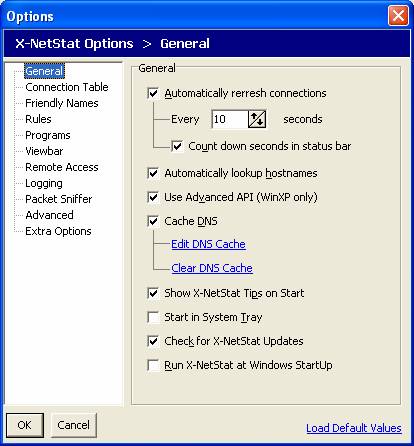
General Options Auto refresh connections – When checked, X-NetStat will refresh the Connection Table for you automatically so you don’t have to push the Refresh button each time. Count down seconds in status bar – When checked, X-NetStat will count down the last 5 seconds until a refresh. Auto lookup hostnames – When checked, X-NetStat will attempt to resolve all IP addresses to a hostname. Use Advanced API – When checked, X-NetStat will display the process / EXE behind each connection in the Connection Table. Cache DNS – Stores the results of an IP to hostname lookup for future reference. Speeds up the application. Edit DNS Cache Opens the DNS Cache in Notepad for manual editing. Clear DNS Cache Clears the cache and looks up every IP address from scratch. Show X-NetStat Tips – Displays helpful tips and hints on how to use X-NetStat when the program starts. Start in system tray – When checked, X-NetStat will start minimized to the system tray. Check for X-NetStat Updates – Checks Fresh Software’s website on startup to make sure you are running the latest version of X-NetStat. Run X-NetStat at Windows startup – Loads X-NetStat every time Windows starts.
|
Click Load Default Values link to revert to X-NetStat’s default settings (the settings used on the first install) |
|
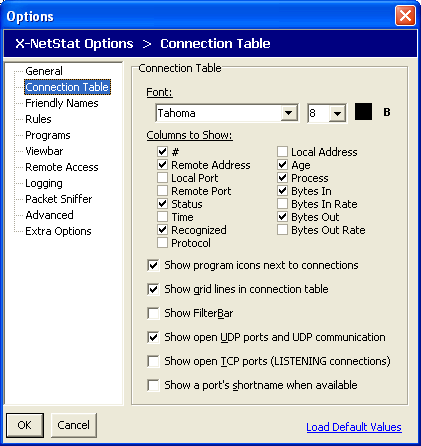
Font – Picks the font face, the size, color and style of the font used for the Connection Table.
Columns
– Shows and hides columns in Show program icons – Shows a 16x16 icon of the program (process) next to each connection under Windows XP. Show grid lines – Separates information in the Connection Table with lines for easier reading. Show FilterBar – Turns the Filter Bar on or off. When the Filter Bar is on, type into a text field at the top of the connection table to show ONLY connections that match that criteria. You can use multiple filters by using a comma. For example, to show .com addresses but hide all .net addresses use: .com, %.net
This option can also be toggled from the View menu, or by
clicking the funnel icon Show open UDP ports – Displays UDP listening ports in the Connection Table. Show open TCP ports – Displays TCP connections with “Listening” status (AKA Open Ports) in the Connection Table. Show a port’s shortname when available – Displays a “code” word (from the Port Database) for local and remote ports instead of numbers. If the port is not in the Port Database, only the port number will be shown. To display BOTH shortname and numbers, also check Show Port Numbers with Shortnames in the Extra Options section.
|
|
|
Here is where you can edit all of your recognized friendly names. See Also: Friendly Names |
|
|
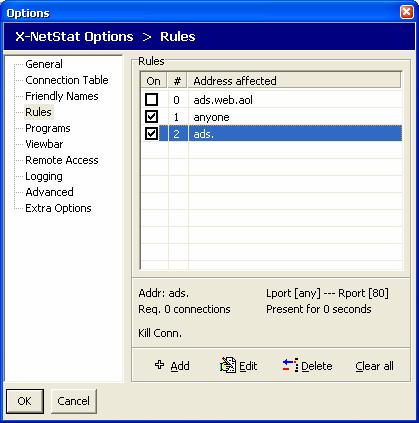
This page displays all your rules and allows you add, edit, and delete them. You can enable or disable a rule by checking the box in the “On” column. See also: Rules |
|
|
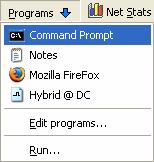
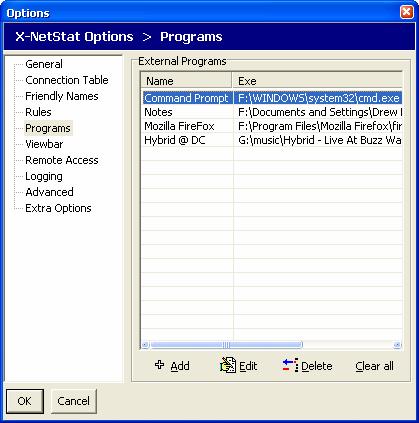
This page lists all the external programs to be shown under the Programs button on the toolbar.
Click Add to add a new program/file to the list. A window will appear asking for the location of the file, folder, or URL and a name to give it. When you click this item in the Programs dropdown menu (shown above), the program, file, or URL will launch. |
|
|
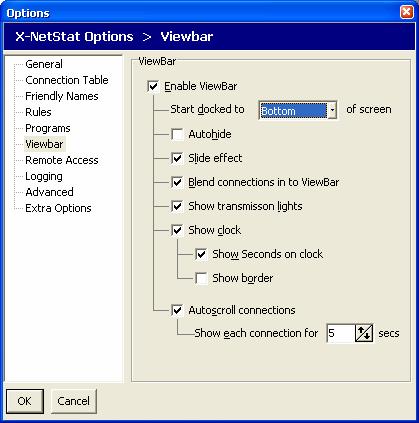
Enable ViewBar – When checked, X-NetStat shows the ViewBar by default. Start Docked to – The initial dock location of the ViewBar. Autohide – Hides the ViewBar at the very top or bottom unless the mouse is hovered over it.
Slide Effect
– Animate the ViewBar when it is changing position. Blend Connections – An alternate style to show the ViewBar in. Show transmission lights – Shows transmission LEDs, the same ones on the status bar. Show Clock – Displays the time on the ViewBar. Autoscroll connections – When checked, each connection is shown for a specified time and then the next connection is shown. |
|
|
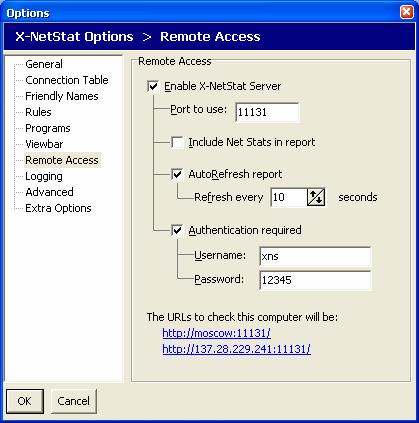
Enable X-NetStat Server – Turns the server on or off. Port to Use – The port on your computer that the server will use. Port 11131 is default. Include Net Stats – Include information from the Net Stats window in the HTML report. AutoRefresh – Includes a META Refresh tag so the page is reloaded every few seconds. Authentication required – Password protects access to the X-NetStat server. You must know the password in order to view the report. URLs – Shows the URLs to access the X-NetStat server.
See Also: Remote Access |
|
|
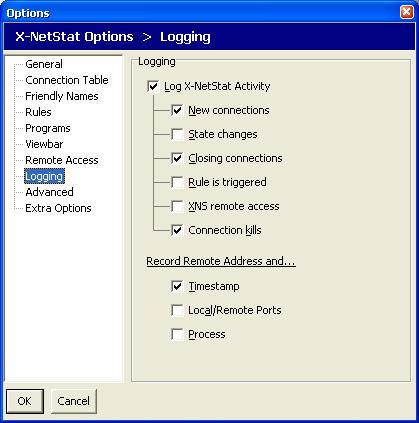
Log X-NetStat Activity – When checked, certain activity in X-NetStat will be logged to a file. Record address and… -- What to include when recording each activity. See also: Logging |
|
|
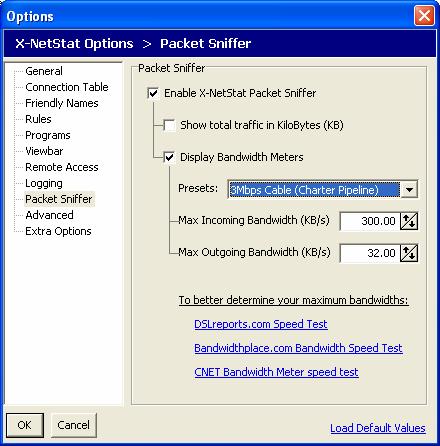
Enable X-NetStat Packet Sniffer – Turns on packet sniffing when checked so XNS can calculate bandwidth usage for each connection. Corresponds to the Sniffer button on the toolbar. Show total traffic in KiloBytes – When checked, displays total traffic in KB instead of bytes. Display Bandwidth Meters – For each connection, shows meteres that measure the portion of total bandwidth used. Enter in the maximum KB/s (KiloBytes per second) for your upstream and downstream connection. You can choose from a preset of common connection types, but this may not accurately represent the bandwidth capabilities of your connection. To accurately figure out your connection speeds, contact your network administrator or Internet Service Provider, or click one of the links to go to an online bandwidth speed test. |
|
See Also: The X-NetStat Packet Sniffer
|
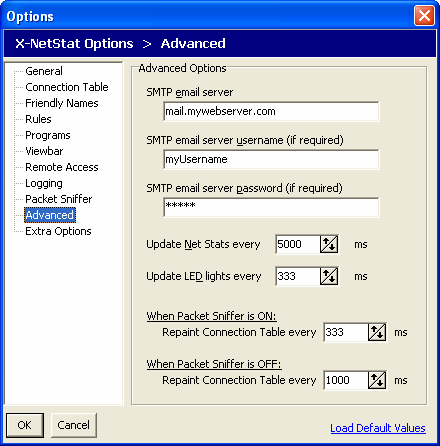
SMTP email server – The outgoing email server to use when sending an email triggered by a rule. SMTP username – If a username is needed to send email on this server, specify it here. SMTP password – If a password must accompany a username, specify it here. Update NetStats – How often to refresh Network Statistics in the Net Stats window. Update LED lights – How often to check bytes in / bytes out to see if a LED should be flashed on or off. Also how often to check the transmission rate. Setting this too low will decrease performance. Recommended setting is 100ms to 500ms. Repaint Connection Table every ___ ms By adjusting these values, you can specify how often X-NetStat should repaint the connection table (in milliseconds) to show updated information. You can choose values for when the Packet Sniffer is either on or off. Lower numbers mean that you will see information updated more quickly, but X-NetStat may end up using more system resources (CPU cycles). Use higher numbers will repaint less often and use less CPU cycles. The default values are recommended. |
|
|
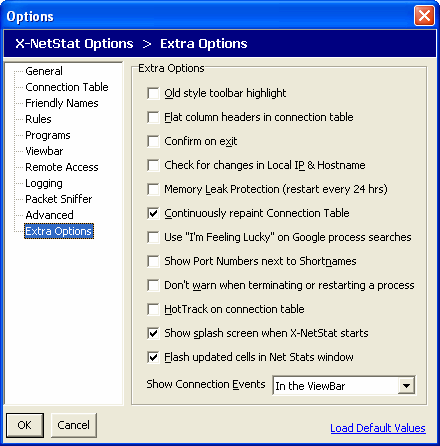
Old style toolbar highlight – Turns a toolbar button’s text blue when the mouse is hovered over it, much like the HotTracking feature in XNS version 4.0. Flat Column headers – Flattens the column headers in the Connection Table. Confirm on Exit – Asks you if you are sure you want to exit X-NetStat when closing. Check for changes in Local IP/Hostname When enabled, XNS will update the Local IP and Local Hostname on every refresh to reflect potential changes. Memory Leak protection – For beta versions only, checking this will make X-NetStat restart itself every 24 hours.
Continuously repaint Connection Table |
|
|
Use I’m Feeling Lucky –
Automatically goes to first Google result when searching for a
process
Show Port Numbers with Shortnames - When enabled, turning on Shortnames will display both the Port’s “code name” and its number. Don’t Warn when Terminating/Restarting - Checking this will disable the confirmation message box when you decide to terminate or restart a process. HotTrack on Connection Table – When checked, you can select a connection by hovering your mouse over it. NOTE: HotTrack may disable the rearranging of column headers! Show splash screen – Shows the X-NetStat splash screen on startup. Flash updated cells – When checked, a border flashes around each value in Net Stats that has changed since the last update of Network Statistics. Show Connection Events - Specifies where you want “Events” (New Connection, Closed Connection, etc) to show up when the program is minimized.
|
|
